-
Biblical Families is not a dating website. It is a forum to discuss issues relating to marriage and the Bible, and to offer guidance and support, not to find a wife. Click here for more information.
You are using an out of date browser. It may not display this or other websites correctly.
You should upgrade or use an alternative browser.
You should upgrade or use an alternative browser.
Media Resources
- Thread starter NickF
- Start date
If you're wasting lots of time formatting it, you need to discover graphviz. Google it and enjoy!
You forgot to put in the ultimate trump card, “but it hurts my feels so God must not like it either”
LOVE this!!You forgot to put in the ultimate trump card, “but it hurts my feels so God must not like it either”
Yeah, I'm not computer savvy enough to understand all that. Using Miro online. Pretty quick and easy for my small brain.If you're wasting lots of time formatting it, you need to discover graphviz. Google it and enjoy!
Yeah... I went, 'Ooooo! A new tool!'Yeah, I'm not computer savvy enough to understand all that. Using Miro online. Pretty quick and easy for my small brain.
Downloaded it then went, 'Ooooh... yeah... this look like trouble trying to install...' <Delete>
x2I like "tell world to pound sand".
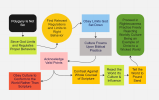
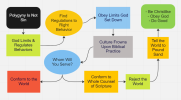
Honestly, I don't know when you'd use that. So I don't know how to assess whether it is "too busy", as I can't imagine an audience.Updated version. Lemme know what you guys think. Still too busy?
The first one is useful and good - I'd just format it as a vertical flowchart instead of an artsy thing going around in a circle, as that would look more professional and easy to follow.
You don't have to install it (though you can do that too)! Just click here.Yeah... I went, 'Ooooo! A new tool!'
Downloaded it then went, 'Ooooh... yeah... this look like trouble trying to install...' <Delete>
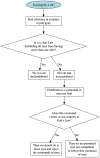
And yes, this is butt-ugly, I just quickly typed it up and didn't fuss around making it look pretty. I'm not saying you should use this version, it's not as nice as @NickF's. But I thought I'd knock it out quickly to demonstrate anyway.
I find this a great tool for formal process diagrams and things like that, as it's all specified in plain text so you can version track it easily (if you're running it on your own machine of course), and change the structure really simply without dragging and dropping stuff around. Graphviz's strength is that you don't actually do the layout at all - that's all automated. You just provide the structure and the computer decides how to draw the picture. It's really handy when you have a massive diagram and want to make a change. Not great when you're making a small thing like this and you want to tweak every detail to make it look perfect. But a handy tool to know about in case you ever need to make a diagram of something majorly complex.
Code:
digraph {
    node[shape=box]
    question -> find -> law
    law -> yes [label="Yes"]
    law -> no [label="No"]
    no -> men -> violate
    violate -> violateyes [label="Yes"]
    violate -> violateno [label="No"]

    question[label="Is polygyny a sin?",style=filled,fillcolor=lightblue,shape=ellipse]
    find[label="Find reference in scripture \n to polygyny"]
    law[label="Is it a clear Law \n forbidding all men from having \n more than one wife?",shape=diamond]
    yes[label="Yes it is sin \n and prohibited"]
    no[label="Not sin and \n not prohibited"]
    men[label="Prohibition is a command of \n men not God"]
    violate[label="Does this command \n violate or run contrary to \n God's Law?",shape=diamond]
    violateyes[label="Then we should do as \n Jesus says and reject \n the commands of men"]
    violateno[label="Then we are permitted \n (but not compelled) \n to follow this command \n of men"]
}Linea Kiwi's are easier to follow.You don't have to install it (though you can do that too)! Just click here.
And yes, this is butt-ugly, I just quickly typed it up and didn't fuss around making it look pretty. I'm not saying you should use this version, it's not as nice as @NickF's. But I thought I'd knock it out quickly to demonstrate anyway.
I find this a great tool for formal process diagrams and things like that, as it's all specified in plain text so you can version track it easily (if you're running it on your own machine of course), and change the structure really simply without dragging and dropping stuff around. Graphviz's strength is that you don't actually do the layout at all - that's all automated. You just provide the structure and the computer decides how to draw the picture. It's really handy when you have a massive diagram and want to make a change. Not great when you're making a small thing like this and you want to tweak every detail to make it look perfect. But a handy tool to know about in case you ever need to make a diagram of something majorly complex.
View attachment 4061
Code:digraph { node[shape=box] question -> find -> law law -> yes [label="Yes"] law -> no [label="No"] no -> men -> violate violate -> violateyes [label="Yes"] violate -> violateno [label="No"] question[label="Is polygyny a sin?",style=filled,fillcolor=lightblue,shape=ellipse] find[label="Find reference in scripture \n to polygyny"] law[label="Is it a clear Law \n forbidding all men from having \n more than one wife?",shape=diamond] yes[label="Yes it is sin \n and prohibited"] no[label="Not sin and \n not prohibited"] men[label="Prohibition is a command of \n men not God"] violate[label="Does this command \n violate or run contrary to \n God's Law?",shape=diamond] violateyes[label="Then we should do as \n Jesus says and reject \n the commands of men"] violateno[label="Then we are permitted \n (but not compelled) \n to follow this command \n of men"] }
Thanks! I'll see if I can figure out how to use that... I do know, a simple diagram like your output in the hands of the right fiverr can result in an eyepopping attention grabber!You don't have to install it (though you can do that too)! Just click here.
And yes, this is butt-ugly, I just quickly typed it up and didn't fuss around making it look pretty. I'm not saying you should use this version, it's not as nice as @NickF's. But I thought I'd knock it out quickly to demonstrate anyway.
I find this a great tool for formal process diagrams and things like that, as it's all specified in plain text so you can version track it easily (if you're running it on your own machine of course), and change the structure really simply without dragging and dropping stuff around. Graphviz's strength is that you don't actually do the layout at all - that's all automated. You just provide the structure and the computer decides how to draw the picture. It's really handy when you have a massive diagram and want to make a change. Not great when you're making a small thing like this and you want to tweak every detail to make it look perfect. But a handy tool to know about in case you ever need to make a diagram of something majorly complex.
View attachment 4061
Code:digraph { node[shape=box] question -> find -> law law -> yes [label="Yes"] law -> no [label="No"] no -> men -> violate violate -> violateyes [label="Yes"] violate -> violateno [label="No"] question[label="Is polygyny a sin?",style=filled,fillcolor=lightblue,shape=ellipse] find[label="Find reference in scripture \n to polygyny"] law[label="Is it a clear Law \n forbidding all men from having \n more than one wife?",shape=diamond] yes[label="Yes it is sin \n and prohibited"] no[label="Not sin and \n not prohibited"] men[label="Prohibition is a command of \n men not God"] violate[label="Does this command \n violate or run contrary to \n God's Law?",shape=diamond] violateyes[label="Then we should do as \n Jesus says and reject \n the commands of men"] violateno[label="Then we are permitted \n (but not compelled) \n to follow this command \n of men"] }
For those of you who haven't looked up the Numbers 1 census. Brings to light a stark mathematical proof.
If each of those Firstborn Males was born to a household, there must be quite a few children born to each household.
There were 603,550 Fighting Men. Work the math out, and you eventually get to the number of males born to each household. If females are born at an equal rate, we should assume an equal number of females born to each household. That means at least 54 children born to each household. But that's if there is no infant mortality. These figures assume no stillbirths, no miscarriages. I calculated the most childbearing years a woman is likely to experience at 26 years. That might go higher or lower since historically we know women married often at 15 years old, but it's unlikely for most women to be successful at childbearing older than her early 40's.
I included a barrenness factor of 12% to account for the natural distribution of barren women in most populations.
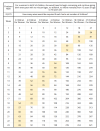
This first chart shows how many wives would be required per household to achieve the numbers of children needed. Assumed number of 54 children born per household, next to that is the Average number of 63 which assumes an average between a 0% infant mortality and the final block which shows how many children would need to be conceived/birthed to produce enough children to get the 27 surviving males.
The highlighted cells show the number of children born to the household with X number of wives which is found by looking in the same row at the far left. 69 children born from 3 wives if every woman birthed a surviving child every year (and the child made it to adulthood to be counted). This is of course practically impossible, each woman birthing a child every 2nd year is much more reasonable and shows the man would need about 6 wives to hit a low infant mortality number. And if each woman birthed a child every 3rd year, the man would need between 10 and 13 women.
I worked this up quite some time ago and just today came back across it. So my numbers could be off, and heck, I could have the base data wildly off. So if someone catches a mistake, I'd appreciate hearing about it so I can fix it on my spreadsheet. But I think I got the figures correct.
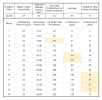

This chart shows base numbers assuming zero mortality of either women in childbirth, or infant mortality.
Granted scripture shows us information that's relevant, but the vast majority of the women listed in genealogies seems to show that women didn't have 12+ children born to them during their lifespan. Most had between 3 and 6. But still at 6 children per woman on average, a man would need a minimum of 9 wives and this is all assuming zero children died in childbirth or before reaching the age where they are counted.
Even if we believed each woman was capable of producing 27 children in her lifetime, that's a minimum of 2 wives per man.


